
Your team received 100 enquiries last month. Was that a good month?
The number alone cannot tell you. Some leads may have received a quick response and booked a consultation. Others may still be waiting for a callback. A few may have become customers without anyone updating their records.
Lead tracking helps you understand what happens after an enquiry arrives. It shows whether leads receive attention, where conversations stall and which sources produce customers.
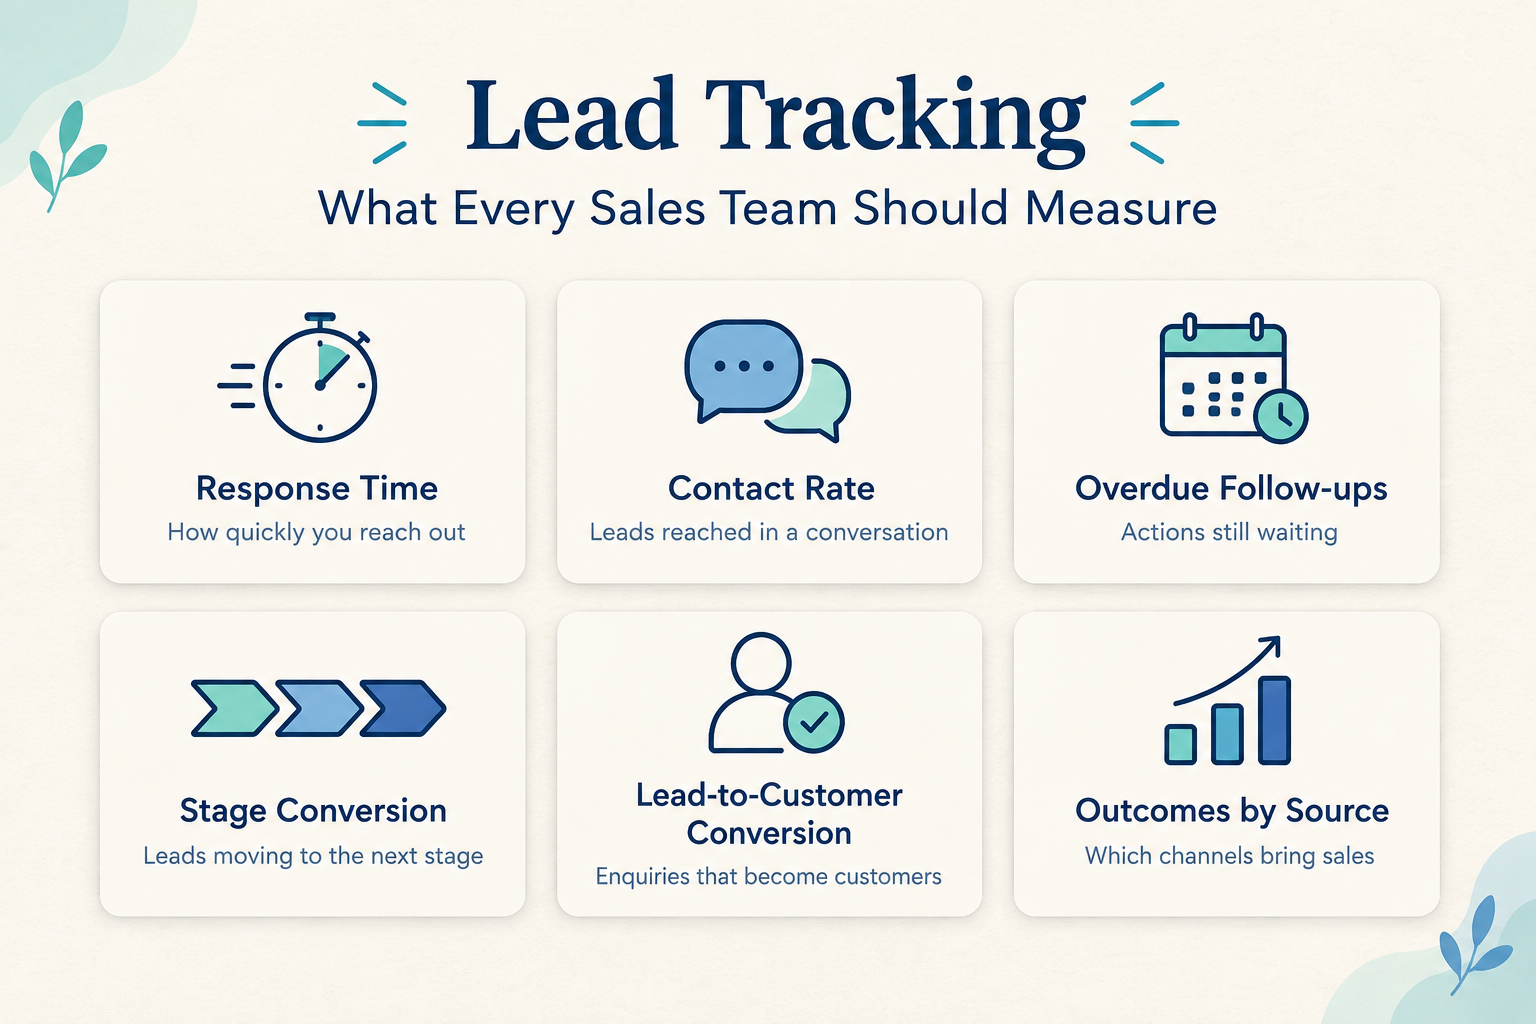
For most sales teams, the best starting point is a small set of measures: response time, contact rate, follow-up completion, stage conversion and outcomes by source.
Here is how to measure them—and what to do with the results.
What Is Lead Tracking?
Lead tracking is the process of recording a potential customer’s source, interactions, sales stage and outcome from the first enquiry onward.
A useful lead record answers:
- Where did this enquiry come from?
- Who is responsible for it?
- Has a two-way conversation happened?
- What does the prospect need?
- What stage have they reached?
- What happens next, and when?
- Did they become a customer?
Tracking supports the wider lead management process by giving your team the information needed to prioritise work and review results.
Keeping contact details is only the beginning. The record should help someone take the next action.

1. New Leads by Source
What it measures: How many new enquiries arrive through each channel during a defined period.
Sources might include Facebook Lead Ads, Google campaigns, website forms, referrals or walk-in enquiries.
This tells you where demand originates and helps you plan workloads. It also gives you a starting point for comparing marketing performance.
How to measure it
Record a consistent source for every new lead. Where useful, record the campaign separately.
Avoid treating “Facebook,” “FB” and “Meta ad” as three unrelated sources. Agree on naming conventions so reports remain usable.
Also decide how to handle duplicates. A prospect submitting the same form twice should not automatically count as two new sales opportunities.
What to do with the result
Compare lead volume with qualification and eventual sales.
For example, a campaign may generate many enquiries outside your service area. The volume looks promising, but the team spends time contacting people it cannot serve.
Use that finding to review targeting, form questions and the offer.
2. First Human Response Time
What it measures: The time between an enquiry arriving and the team’s first human response attempt.
This is an important part of speed-to-lead. It helps you see whether new enquiries are waiting without attention.
How to measure it
Record the enquiry timestamp and the first human outreach timestamp.
Keep automated acknowledgements separate. An instant “Thank you for your enquiry” message does not show that a salesperson has reviewed the request.
Useful views include:
- Median first-response time.
- Percentage receiving human outreach within your target window.
- Leads still waiting for a first response.
Review unanswered leads alongside response-time figures. Measuring only leads that eventually received attention can hide the ones your team missed entirely.
What to do with the result
If responses are slow, investigate ownership, notifications and workload.
You may discover that enquiries arriving during lunch breaks have no assigned cover, or that one salesperson receives more leads than they can handle.
Define how you treat enquiries outside working hours. Use the same method each reporting period.
3. Contact Rate
What it measures: The proportion of leads that result in a two-way conversation.
A call attempt, a delivered message and an actual conversation are different events.
How to measure it
For a defined group of leads, divide the number with a two-way conversation by the total number in that group, then multiply by 100.
For example, if 30 of 50 leads have a two-way conversation, the contact rate is 60%.
Give every group a comparable contact window. Leads received an hour ago have had less opportunity to respond than leads received last week.
What to do with the result
A low contact rate can point to:
- Incorrect contact details.
- Long delays before outreach.
- Calls at unsuitable times.
- Messages that do not explain the reason for contact.
- Inconsistent follow-up.
Review a sample of records before changing the process.
Keep call answer rate separate from lead contact rate. One measures answered calls; the other measures unique leads reached through two-way communication.
4. Qualification Rate
What it measures: How many leads meet your agreed criteria for a suitable opportunity.
Qualification helps distinguish sales execution problems from enquiries that were unlikely to become customers.
For an interior design business, relevant criteria might include location, project type, budget range and expected start date. An education business may check course interest, eligibility and intended intake.
How to measure it
Agree on what “qualified” means before reporting it.
You can measure qualified leads as a share of all new leads or as a share of contacted leads. Label the denominator clearly and use it consistently.
Track leads awaiting qualification separately. Someone who has not answered is not necessarily unsuitable.
What to do with the result
If contact rates are healthy but qualification rates are low, review marketing messages, targeting and enquiry forms.
If qualification decisions vary widely between team members, review the criteria and a few example records together.
5. Follow-Up Completion and Overdue Actions
What it measures: Whether planned callbacks, messages and other next steps happen when promised.
A promising enquiry can stall because nobody sends the quotation or makes the agreed callback.
How to measure it
Review three related measures:
For on-time completion, compare actions due during a period with those completed by their deadlines.
Keep cancelled or genuinely unnecessary tasks separate so your team cannot improve the figure simply by deleting overdue work.
What to do with the result
Review overdue work daily.
Check whether the issue is excessive workload, unclear priorities or poor record keeping. Reschedule with a reason when necessary, and close tasks that no longer apply.
A completed call attempt does not necessarily mean the prospect was reached. Record the outcome and schedule the next appropriate action.
6. Stage Conversion Rate
What it measures: The proportion of leads that progress from one defined sales stage to another.
A simple pipeline might be:
New → Contacted → Qualified → Meeting or Quote → Decision Pending → Won or Lost
Use stages that reflect your actual buying process.
How to measure it
Follow a defined group of leads that entered a stage and count how many subsequently reached the next stage.
For example, if 20 qualified leads receive a proposal and eight eventually buy, proposal-to-sale conversion for that group is 40%.
A snapshot showing 20 proposals and eight wins in the same month does not establish that conversion rate. Those wins may have come from older proposals.
What to do with the result
Investigate the stage where progress drops.
Low movement from contacted to qualified may indicate unsuitable enquiries. Low movement from proposal to sale may require a review of pricing, proposal clarity, decision timelines or follow-up.
Stage conversion helps you choose which part of the process to examine.
7. Time in Stage and Time to Close
What it measures: How long opportunities remain at each stage and how long successful leads take to become customers.
These measures help identify stalled deals and set realistic expectations.
How to measure it
Track when each lead enters its current stage.
For won leads, measure the time from the initial enquiry to the recorded sale. Review the median as well as the average when a few unusually long deals distort the picture.
Keep the age of open opportunities separate from the closing time of won deals.
What to do with the result
Review opportunities that have stayed in a stage longer than is normal for that type of sale.
A lead waiting for a site visit needs a different action from someone comparing proposals. Ask the owner to record the blocker and next step.
Avoid applying one deadline to every business or deal type. An insurance renewal and a large interior design project have different decision cycles.
8. Lead-to-Customer Conversion Rate
What it measures: The proportion of a defined group of leads that eventually become customers.
This connects enquiry generation with sales outcomes.
How to measure it
Divide customers won from a lead group by the total leads in that group, then multiply by 100.
If six of 60 enquiries received in June eventually become customers, that group’s conversion rate is 10%.
Allow enough time for the normal sales cycle. If some opportunities remain open, label the result as provisional.
What to do with the result
Compare similar groups by source, service, campaign or owner.
Use those comparisons carefully. A salesperson handling qualified referrals is working with a different starting point from someone handling new advertising enquiries.
Also distinguish lead-to-customer conversion from win rate. Win rate often uses closed outcomes as its denominator; lead-to-customer conversion includes the whole defined lead group.
9. Won Deal Value and Outcomes by Source
What it measures: Which sources produce customers and recorded sales value.
Lead volume and conversion rate do not show the full commercial picture.
One source might produce fewer customers with larger purchases. Another might generate many small sales that require substantial servicing effort.
How to measure it
Compare sources using:
- New leads.
- Qualified leads.
- Customers won.
- Recorded won deal value.
- Acquisition spend, where available.
Be clear about what your value field represents. Quoted value, won deal value, invoiced revenue and cash collected are different figures.
Document how source attribution works, especially when a prospect interacts with several channels before buying.
What to do with the result
Use source outcomes to guide further investigation and budget decisions.
Do not call revenue divided by advertising spend “profit.” Profitability also depends on delivery costs, margins and other expenses.
10. Lost Reasons
What it measures: Why opportunities ended without a sale.
Useful categories might include unsuitable requirements, price, timing, competitor selected or no longer proceeding.
How to measure it
Record a reason when closing an opportunity as lost, with a short note where context matters.
Keep “unknown” available. If a prospect stops replying, the team should not assume price was the issue.
Separate unsuitable enquiries from opportunities that qualified but were later lost.
What to do with the result
Review patterns alongside conversation notes.
Frequent price objections may justify reviewing how value is explained, which audience you target or what the package includes. They do not automatically mean you should lower prices.
How Often Should Your Team Review Lead Tracking Metrics?
Different measures support different decisions.
Keep the daily review short and focused on work that needs attention.
Use weekly and monthly reviews to investigate patterns rather than react to every small fluctuation.
How Ridhzo Supports Lead Tracking
Once your team agrees on definitions and keeps records current, CRM reporting can make these reviews easier.
Ridhzo’s documented dashboards and Insights support several of the measures discussed here:
- Response performance: Average and median response time, response-target compliance and the share of leads contacted within five minutes.
- Follow-up visibility: Due-today and overdue follow-ups, plus follow-up completion rates.
- Call activity: Call volume, duration and answer rates, with automatic call activity logging through Android devices.
- Pipeline review: Pipeline distribution, aging, stuck deals and time between stages.
- Outcome analysis: Source-level revenue and win rates, grouped loss reasons and cohort analysis.
Salespeople can use My Dashboard to review their assigned leads and daily follow-ups. Managers can use the Executive Dashboard for operational oversight and Insights for deeper analysis.
Check each report’s definition before comparing it with your own calculations. For example, Ridhzo documents personal dashboard win rate as won leads divided by won, lost and unqualified leads combined. That differs from the lead-to-customer conversion measure described above.
Start with response time, overdue follow-ups and pipeline progress. Expand your reporting when each additional measure answers a clear business question.
Frequently Asked Questions
What are the most important lead tracking metrics?
Start with first human response time, contact rate, overdue follow-ups, stage conversion and lead-to-customer conversion. Add source outcomes to connect marketing activity with sales results.
Can a small sales team track leads in a spreadsheet?
Yes, if enquiry volume is manageable and updates are consistent. Include source, owner, status, key timestamps, next action and outcome. Reporting becomes harder when conversations and updates are spread across several people and channels.
What is a good lead conversion rate?
There is no universal benchmark. Conversion depends on the source, offer, qualification criteria, price and sales cycle. Compare similar groups using consistent definitions and enough time for outcomes to develop.
Is call volume a useful lead tracking metric?
Call volume shows activity and can help explain workload. Review it alongside answer rate, meaningful conversations and lead progress. More attempts alone do not demonstrate better sales performance.
How do you make lead tracking more accurate?
Agree on field definitions, assign one responsible owner, record outcomes promptly and give every active lead a dated next action. Review missing sources, duplicate records and outdated statuses regularly.